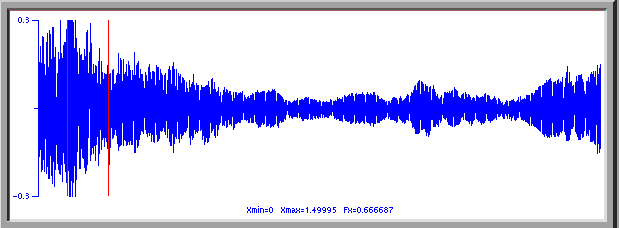
To see this, I have used a passage from a recording of the Tuvan singers ( from a tape called Tuva, ******) to look at the Fourier analysis of the sounds produced during a transition in the singing where the listener just hears the singer producing a harsh drone tone to one where suddenly the high flutelike note bursts forth, with the droning tone becoming much quieter.

This graph represents a selection of about two seconds in length from the singer making the transition from the ordinary voice drone sound to the high pitched, flute like sound, with a quiet drone of the syngyt style of song. The two red lines delineate the region of the sound for which the next graph gives the fourier spectrum of that sound.
 .
.
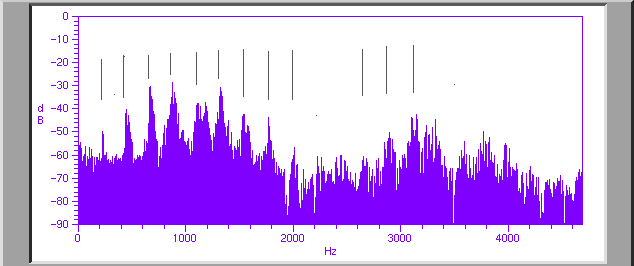
This spectrum extending up to about 5 KHz shows the peaks (indicated by the black lines above the spectrum) corresponding to the harmonics of the drone sound produced by the singer just befor the transition to the two-toned throat singing. These peaks occur at roughly 230Hz separation, indicating a sound with a pitch of about B3 . Note that there is a broad formant ( resonance) extending from about 400Hz to just under 2KHz, and another at around 3KHz. Note that at about 2KHz there is essentially no power in his voice.
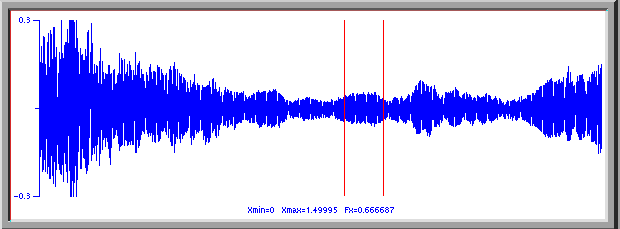
In this next selection, taken about one second later than the above, the singer has switeched into the throat singing. The net amplitude of the sound has decreased substantially ( by a factor of about 3, or about 10dB) but the sound produced is much louder than befor with a very strong flute like sound.
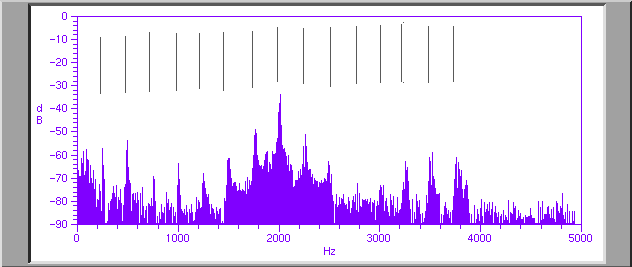
Here we have the spectrum of that voice taken during this period of throat singing. Note that it looks entirely different. The peaks ( more well defined than in the previous case) still occur in the same places. The singer is still singing with a pitch around B3 just as befor. However the formant structure of the sound has changed almost completely. That broad resonance from 400 Hz to around 2KHz has dissapeared. The sounds in this regime are about 25dB quieter than previously. Similarly the broad resonance just above 3KHz, although still there somewhat, has also almost disappeared. Instead the spectrum is dominated by the huge narrow peak at about 2KHz. This eighth harmonic exceeds the amplitude of any of the other harmonics of the drone sound by about 15dB. The ear singles out this sound as a totally different sound from the drone (even though both are produced by the same vocal chords), and presents it to the mind as a single pure flute like sound ( pitched at about B6), three octaves above the drone.
The throat singer can alter the harmonic which he emphasises and in this way change the pitch of the note which one hears coming from the singer. In this case he can emphasise from about the sixth to the tenth harmonics.
Another singer on the same record tends to drone at about 200Hz, but again, the emphasised peak is concentrated arount 2kHz( in that case the 10th harmoic).
One of the features of the fourier transform graphs above (graphs giving the stength of the various frequencies in the sound). In these graphs I argue that there are various peaks in the graph at the harmonics of the note that the singer is singing ( about 230Hz in the above case)-- indicated by the black lines above the graph. But one of the features is that there seems to be a lot of junk at almost all frequencies. While one can see that (probably) at the frequencies marked by the black line, the intensity is higher than at other frequencies nearby, there seems to be a lot of itensity at other frequencies not at those harmonics.
While some of that could well be due to noise on the recording, much of it is probably due to the way in which the frequencies are calculated. There is almost always a problem on these types of graphs with the calculations of the frequencies contained in the original sound. In particular, if the sound does not have an exact number of periods in the time interval over which the spectrum is calculated, then, even if the sound is a perfect sinusoidal sound-- one which should have only one, sharp spike on the frequency graph-- it will not produce such a single sharp spike. Instead the graph will look like it is peaked near the frequency of the sinusoid, but also contains non- zero amounts of intensity at nearby frequencies. In the next graph I have plotted the spectum of a pure sinusoid which however instead of having exactly an integer number of periods in the time interval over which the spectrum is calculated, it has an extra half period. Note that instead of having just a single spike at the frequency of the sinusoid, the peak has tails which extend to either side.
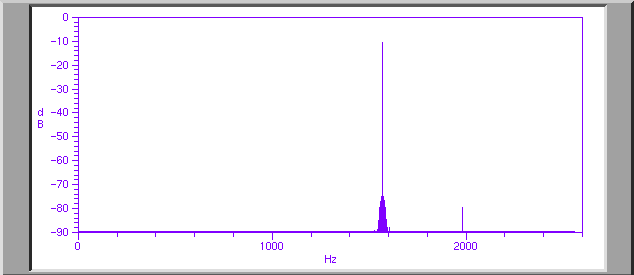
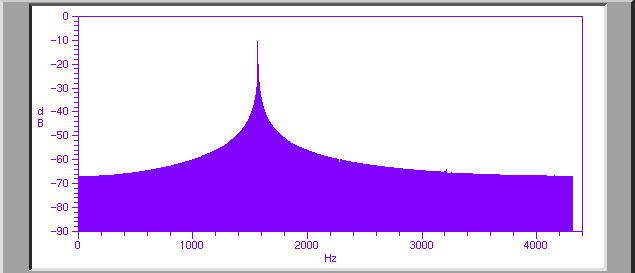
Much of the extra "noise" in the Tuva spectra almost certainly comes from this kind of phenomenon. Ie, the time span over which the frequencies were determined is not the same as a multiple of the period of the note that the singer is singing.
In addition, one will get a broader spectrum of noise if the amplitude and the phase of the sinusoid vary during the course of the time period. While the ears are well designed to hear a single pitch even if the singer gets quieter and louder during the course of the note, the mathematical technique used to calculate the spectrum is not. It sees the changes in amplitude as being like the change in amplitude during beats-- as being due to the interference of close by frequencies, and thus reports amplitude changes as being a spread in frequencies. The same is true of phase shifts or small changes in the frequency (as in vibrato) which the technique reports as being due to the interference of a variety of frequencies, thus spreading out the spectrum.